

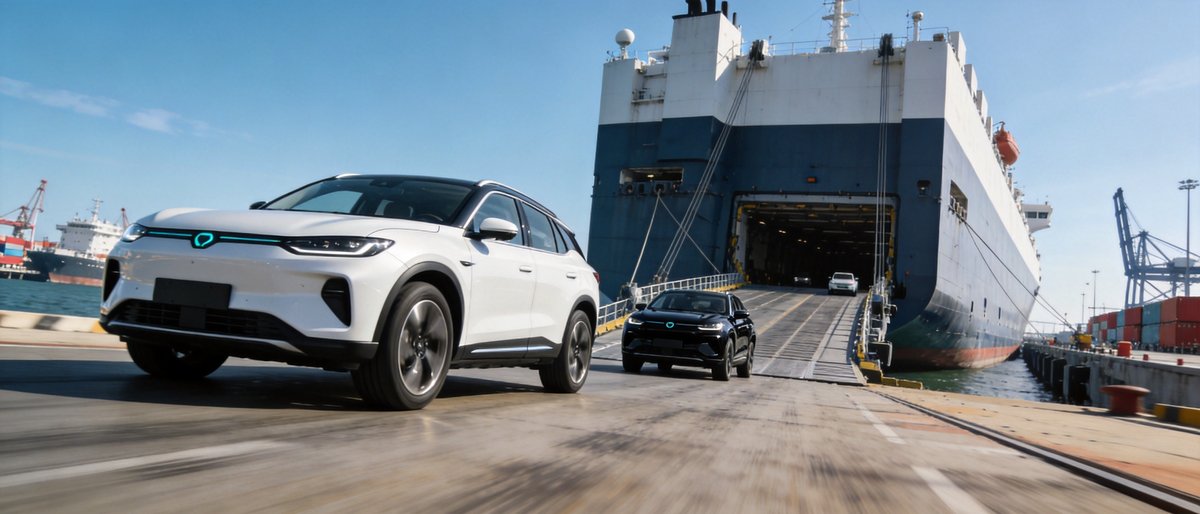
Introduction: The Great Divergence in H1 2026 Auto Trade
The first half of 2026 has revealed a stark structural divergence in the global automotive industry. While overall passenger car markets face volume pressures, international auto trade is experiencing unprecedented shifts. For B2B buyers, importers, and global traders, understanding these macroeconomic and supply chain dynamics is critical for strategic sourcing and market positioning.
China's New Energy Vehicle (NEV) sector continues to act as the primary engine for global export growth, even as domestic profit margins face severe compression from upstream supply chain costs. Meanwhile, global EV adoption is polarizing, with Europe surging and North America retreating. This article breaks down the critical H1 2026 data and outlines strategic implications for international automotive stakeholders.
China's Export Engine: NEVs Drive Record-Breaking Volumes
Overseas expansion has transitioned from a supplementary growth driver to the core stabilizer for Chinese automakers. According to data from the China Association of Automobile Manufacturers (CAAM) and the Ministry of Industry and Information Technology, China's total auto exports in the first half of 2026 reached 5.096 million units, a massive year-on-year increase of 65.3%.
The momentum is overwhelmingly driven by the NEV sector. In H1 2026, NEV exports totaled 2.355 million units, surging by 120% compared to the previous year, accounting for over 46% of total auto exports. The export velocity accelerated in June, with total auto exports crossing the one-million mark for the first time at 1.037 million units (+75.1% YoY). NEV exports in June alone hit 523,000 units, skyrocketing 160% year-on-year.
Leading Chinese OEMs are aggressively capturing this overseas demand. For instance, Chery Automobile exported 943,800 units in H1 (+71.5%), while Geely's exports surged 158% to 474,200 units, surpassing its entire 2025 export volume in just six months. This massive outward flow ensures that international buyers have access to a robust and increasingly diverse supply of Chinese NEVs and traditional vehicles.
Global Market Divergence: Europe Surges, North America Stalls
While Chinese exports flourish, the destination markets are experiencing vastly different growth trajectories. According to Benchmark Mineral Intelligence, global EV sales reached 2 million units in June 2026, bringing year-to-date sales to 9.6 million. However, regional performance highlights a widening split.
- Europe: Remains the main engine of growth, setting a record month in June with 530,000 units sold (+31% YoY, +28% MoM). The introduction of affordable, small electric cars from brands like Renault is successfully accelerating consumer transition.
- Rest of World (RoW): Emerging markets are booming, with EV sales up 98% year-on-year in June. Year-to-date RoW sales reached 1.4 million units, reflecting a 91% increase and highlighting massive untapped potential for exporters.
- North America: The region continues to lose ground, with June sales dropping 13% YoY to 130,000 units. The elimination of federal EV tax credits has significantly dampened consumer demand, creating a challenging environment for cross-border trade.
For global traders, this divergence signals a need to reallocate inventory and marketing focus toward European and emerging markets, where policy support and consumer demand remain highly favorable.
The Profitability Squeeze: Supply Chain Costs and Domestic Pressures
Despite record export volumes, Chinese automakers are navigating a brutal profitability squeeze. The era of aggressive, below-cost price wars is being curtailed by regulatory interventions from the Ministry of Industry and Information Technology, but upstream supply chain costs are rising relentlessly.
Key material costs have surged dramatically. Storage chip prices have jumped from 20 RMB to 100 RMB, while lithium carbonate prices have more than doubled from 80,000 RMB to 180,000 RMB. Consequently, the overall cost per vehicle has increased by 6,000 to 14,000 RMB.
The impact on manufacturer margins is severe. Data indicates that the industry's profit margin in Q1 2026 fell from 6.1% to 3.2%, with the gross profit per vehicle dropping from 23,000 RMB to 14,000 RMB. To illustrate the disparity in the value chain, the combined net profit of 11 major listed automakers in Q1 was 8.067 billion RMB, whereas a single battery manufacturer, CATL, reported a net profit of 20.738 billion RMB, effectively earning 230 million RMB per day.
This upstream cost pressure means that the ultra-low pricing seen in previous years may gradually stabilize. For B2B buyers, this suggests that current procurement prices from Chinese OEMs represent a highly competitive baseline before further supply chain inflation is passed down the chain.
Strategic Implications for International Auto Buyers and Importers
The H1 2026 data presents clear strategic imperatives for international automotive stakeholders navigating this complex landscape:
1. Capitalize on the Export Surge and Product Diversity
With Chinese OEMs relying heavily on overseas markets to offset domestic pressures, their commitment to international expansion is stronger than ever. Buyers can leverage this by negotiating favorable long-term supply agreements. The rapid iteration of NEV products, particularly in the premium and smart mobility segments, offers importers a chance to introduce highly competitive, tech-forward vehicles to their local markets.
2. Realign Regional Sourcing and Distribution
Given the robust growth in Europe and the Rest of World regions, importers should prioritize securing allocation for these markets. Conversely, strategies targeting North America require careful recalibration due to the policy-driven demand contraction. Diversifying export destinations to include high-growth emerging markets can mitigate regional risks.
3. Anticipate Price Stabilization and Market Maturation
As Chinese regulators halt below-cost selling and upstream battery and chip costs rise, the extreme price erosion is likely to bottom out. Furthermore, the upcoming phase-out of domestic NEV tax preferences by 2027 signifies the era of "oil and electricity equal rights." This means Chinese vehicles are now competing on pure market merit, enhancing their global credibility. Importers can market these vehicles based on technological superiority and intrinsic value rather than just subsidized low prices.
Conclusion
The first half of 2026 underscores a pivotal transition in the global auto trade. China's NEV export dominance is reshaping global supply chains, while regional demand polarizes between a booming Europe, rising emerging markets, and a stalling North America. Meanwhile, severe supply chain cost pressures are forcing a reset in manufacturer profitability. For international buyers and traders, success in this new era requires agile sourcing strategies, a keen eye on regional demand shifts, and a deep understanding of the evolving cost structures within the world's largest auto manufacturing hub.